Enhancing the Plotting Functionality in MCnet/Rivet
Google Summer of Code 2021 Final Report - Simon Thor
Overview
Introduction
Rivet is a tool used by particle physicists to test and develop Monte Carlo event generators, i.e., simulations of particle accelerator collisions. Simulations are crucial for particle physics research, since they can be used to compare theoretical predictions with experimental measurements to discover new physics.
Visualizing the output is a fundamental part of Rivet, since a good visualization makes it intuitive and easy to understand the results. Before the project, plots in Rivet were created by generating and compiling LaTeX commands using a custom python script. While this method does create high-quality plots, it can be slow, have memory issues, be sensitive to the deployment platform, and difficult to debug and enhance.
The goal of this project was to solve the above-mentioned issues by replacing the LaTeX plotting backend with a new plotting backend, based on the matplotlib python package. Additionally, it was necessary to make it easy to export high-quality plots with a simple user interface that meets the needs of most users, while still allowing more customization for advanced users. The plotting program should also be able to output files representing figures in an intermediate format, which allows for easy modifications of a plot.
Contributions
The main tasks I worked on can be separated into 4 parts:
- Making the labels and titles for the analyses in Rivet work for both LaTeX and matplotlib.
- Rewriting the
rivet-cmphistoscommand. - Making it possible to plot 2D histograms.
- Moving some of the core plotting functionality to the YODA package.
These tasks are described in further detail below. Additionally, I made minor contributions not directly related to the main tasks, which are listed under “Other contributions”.
In total, I made over 140 commits to Rivet. Most of these commits were made to the matplotlib-GSoC, while some were made directly to the main branch. The hyperlinks link to a list of all commits I made to each branch, of which all commits made up until 20th August 2021 are part of GSoC 2021.
Mathtext Compatibility
Matplotlib uses mathtext to render mathematical expressions, which is a subset of LaTeX that it can parse and render, without using a LaTeX parsing/rendering backend. Rendering with mathtext removes the need for a dependency on a LaTeX backend and typically improves performance.
Since the plotting backend will be changed from LaTeX to matplotlib, one of the goals of this project was to make all labels in Rivet compatible with mathtext. To make more than 13600 changes, I edited most labels automatically by writing Python code that automated most of the editing process. Some of the labels which required more complex fixes were instead edited manually. In addition to converting labels from LaTeX to mathtext, I also fixed approximately 300 LaTeX syntax errors that existed in some of the labels.
Fixed issues
- Changed
\textto\mathrm, manually fix edge cases where replacing\textwith\mathrmdoes not work, e.g., by replacing spaces in\textwith ~, since\mathrmignores spaces while\textdoes not. - Added curly braces to spots where it is missing from
\frac,\sqrt,\text.- E.g., replacing
\frac12with\frac{1}{2}.
- E.g., replacing
- Changed
\geto\geq,\leto\leq. - Remove
^from\perp^inanalyses/pluginCMS/CMS_2014_I1305624.plot. - Replace
\unitand\siwith alternatives, e.g.,\unit{10}{\GeV}is converted to10~\GeV. - Enclose LaTeX commands such as
\%with $ (i.e. math mode). Otherwise, mathtext will interpret\as plain text. - Replace deprecated
\rmcommand with\mathrm - Remove superfluous
}in some labels that caused LaTeX syntax errors - In analyses/pluginCMS/CMS_2018_I1663958.plot, the
\PQtcommand was used, which cannot be interpreted by mathtext. For the use case in this file, this was replaced with\mathrm{t}. - Added a label preprocessor which will replace commonly used commands, specifically
\GeV,\TeV,\ptand\pT, with valid mathtext. This is applied to all labels before being plotted.
Remaining issues
\textcannot always be replaced by\mathrn, as e.g., “-” in math mode is longer than in plaintext.\microin LaTeX will give the same output as$\mathrm{\mu}$in mathtext. However,$\mathrm{\mu}$in LaTeX will give a non-sensical output. This can therefore not be changed until the backend has been switched completely to mathtext.
Merge status
All mathtext-related contributions I made, besides the code for the mathtext preprocessor, have been merged into the main repository. The related merge requests are:
- https://gitlab.com/hepcedar/rivet/-/merge_requests/293
- https://gitlab.com/hepcedar/rivet/-/merge_requests/295
- https://gitlab.com/hepcedar/rivet/-/merge_requests/303
The code for the mathtext preprocessor is in mathtext_preprocessor.py in the matplotlib-GSoC branch. This file should be moved to the pyext/rivet/ directory when merging matplotlib-GSoC into the main branch.
Rewriting rivet-cmphistos
rivet-cmphistos is a command used in Rivet to create the intermediate format for the plotting files.
The functionality of rivet-cmphistos (and its successor, rivet-mkdat) is described in the figure below:

The command can be called via the command line with the syntax rivet-cmphistos file1.yoda file2.yoda… . Here, file1.yoda, file2.yoda etc are yoda files containing histograms, each histogram with an ID corresponding to an analysis in Rivet. rivet-cmphistos will then create an intermediate .dat file for each ID, which includes all the data and style settings for the plot. This .dat file can then be plotted by rivet-plot, which is explained later.
To use the new backend, the inputs for rivet-cmphistos needed to be changed, as new plot configurations were added while others were removed. This required a complete rewrite of the code behind the command, especially since the syntax for the intermediate format and .plot files were changed from a custom syntax to YAML syntax, to make the files more readable.
The new structure for the .plot files and .dat files were developed during the project and are explained in detail in its documentation.
Fixed issues and new features
- Rewrite most of the code inside
rivet-cmphistosand renaming it torivet-mkdatto make it work for YAML syntax files.rivet-cmphistoswas also a script with unstructured code, while the new code is more modular and is structured as an API with documentation for all functions. - Implement a converter that can read the old .plot files, to retain some backwards-compatibility.
- Add the parameter
--analysispaths, which allows the user to specify additional directories whererivet-mkdatwill search for .plot files and reference .yoda files. This is a more general parameter than--pwd´, which already existed inrivet-cmphistos`. - Remove the parameters
--linear,--no-ratio,--rel-ratio,--no-plottitle,--remove-options, as the same functionality for all of these can be achieved with the PLOT parameter. Removing these arguments thus reduces code complexity without removing any functionality. - Extend the capabilities of the
--styleparameter. It can now be of the format--style some_valid_style_name:key=value:key2=value2…, where the key is a matplotlib rcParam and value is the new value for it.
Additionally, Due to limitations to the old plotting backend, multiple 2D histograms could not be plotted in the same figure. To circumvent this, rivet-cmphistos would output 2D histograms with the same ID into separate .dat files, instead of keeping all 2D histograms in the same file. As an example, each 2D histogram is put in a separate .dat file by rivet-cmphistos. The name of the .dat file then also contains the file name of the input yoda file.
Example
If mc1.yoda, mc2.yoda both contain 2D histograms with ID ALEPH_2019_I1737859/backLab,
rivet-cmphistos mc1.yoda mc2.yoda
would give the output files
ALEPH_2019_I1737859/
  backLab-mc1.dat
  backLab-mc2.dat
The new plotting backend can plot multiple 2D histograms in the same figure (see the 2D histograms section below). No hacky behavior is therefore needed inside rivet-mkdat and all 2D histograms will therefore be included in the same output yaml file, just like how 1D histograms behave. The output file of rivet-mkdat mc1.yoda mc2.yoda is instead
ALEPH_2019_I1737859/
  backLab.dat
Remaining issues
- While the program still can read most parts of the old .plot files, some sections are still not correctly interpreted by the file reader.
- The
--no-weightsflag has not been implemented inrivet-mkdat, as the detailed implementation requires more discussion with maintainers. rivet-mkdatis currently a python function (calledrivet_mkdat) rather than a CLI command. In the future, the CLI commandrivet-mkdatwill be a thin wrapper around this python function.
Merge status
These changes are currently in the matplotlib-GSoC branch and will be merged into the main branch once the new plotting backend can fully replace the current plotting backend.
The main code for rivet-mkdat are in
- rivet_mkdat.py (should be moved to pyext/rivet/ directory)
- old_plotfile_converter.py (pyext/rivet/ directory)
- test_old_plotfile_converter.py (should be added to the CI/CD pipeline)
- yamlio.py (should be moved to the pyext/rivet/ directory)
Plotting 2D Histograms
To plot histograms in Rivet, one can pass the intermediate .dat files to the rivet-plot command, which will create images such as PDFs and PNGs.
The old plotting backend had limited support for plotting 2D histograms. As an example, it could not plot ratios between 2D histograms, which is a crucial feature for 1D histograms in Rivet. One of the main goals of this project was therefore to enhance the 2D histogram plotting functionality.
New features
The plotting code was separated into two parts:
- A general plotting API which can be used to easily plot 2D histograms. By default, this API does not do any styling of the plot but can be used to further customize the look of the plots.
- A Rivet-specific API which uses the general plotting code and applies Rivet-specific styling to the plots.
For the general plotting API, I created 4 plotting functions: heatmap, ratio_heatmap, surface, and ratio_surface, as well as the format_axis function which can be used for styling. A tutorial for the general 2D histogram plotting API can be found in this jupyter notebook.
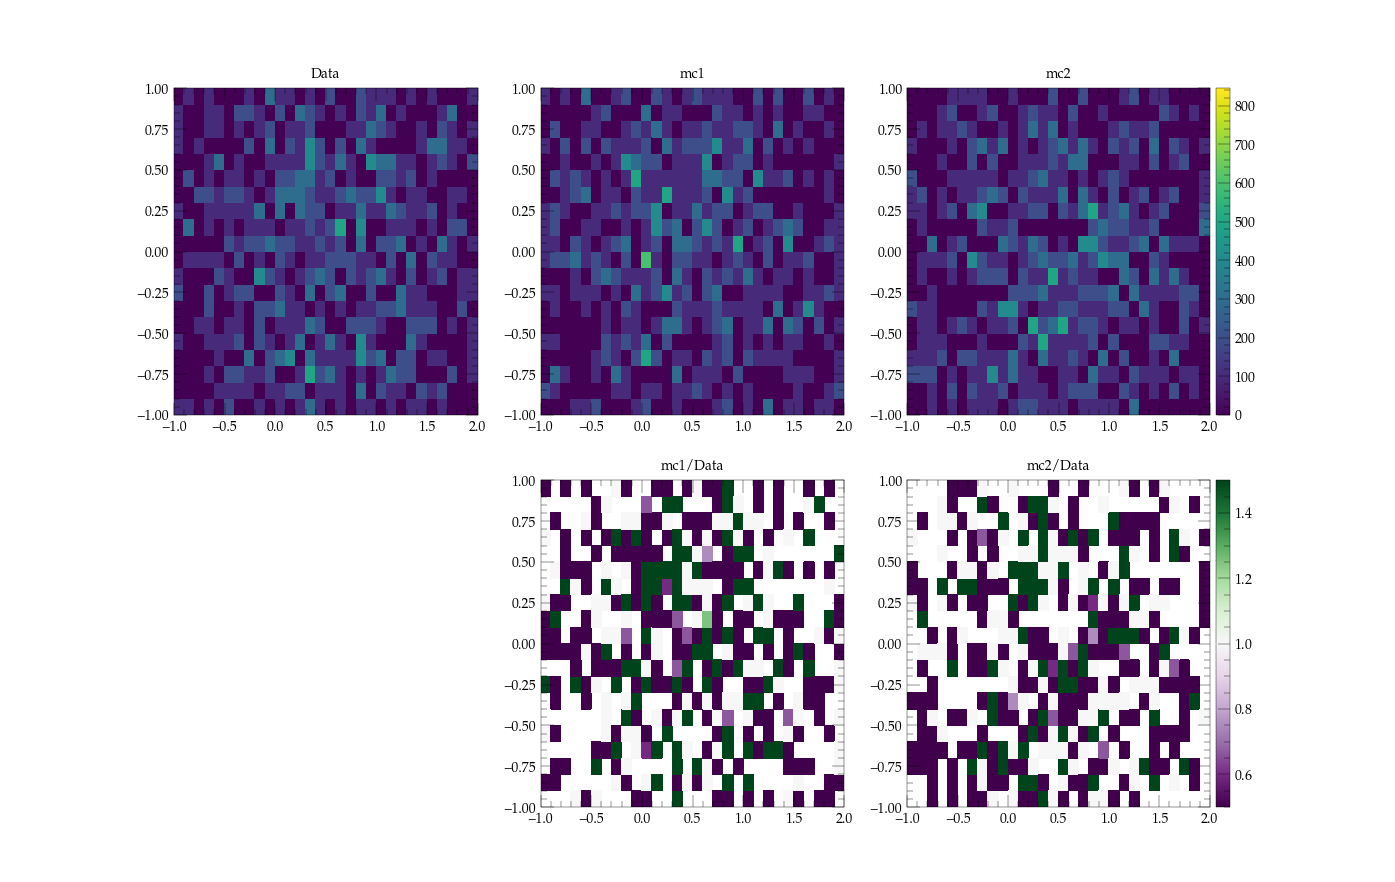
The Rivet-specific API allows users to plot 2D histograms with these 4 plotting functions. The image below shows an example output of the Rivet 2D histogram plotter. The top row contains 2D histograms while the bottom row contains the ratio between the corresponding histogram in the same column and the leftmost 2D histogram in the top row (in this case it is called “Data”), which act as the reference.
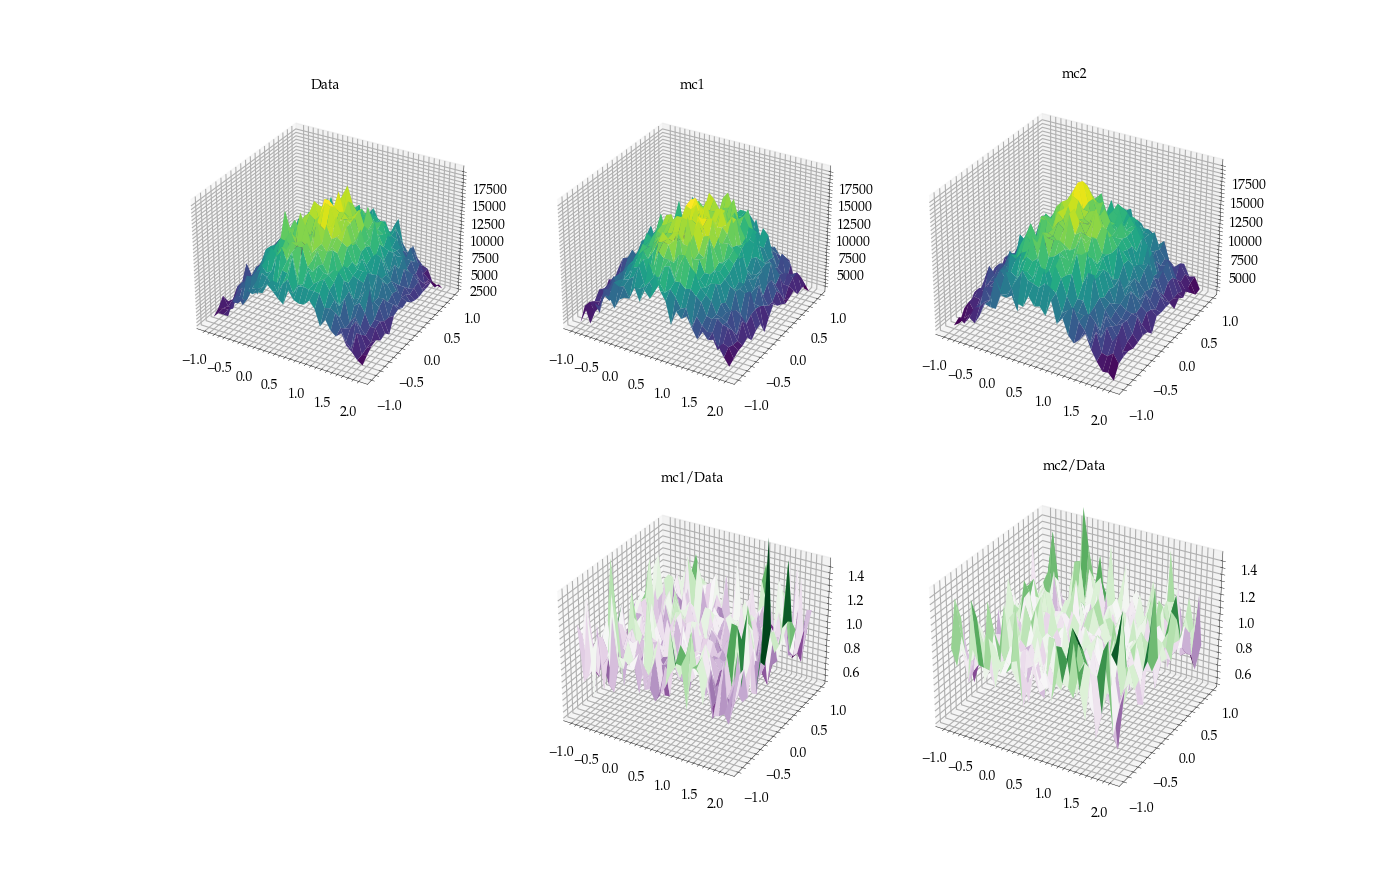
The image below shows another example output of the Rivet plotting API, this time the 2D histograms are plotted as surface plots, which is an alternative to heatmaps for visualizing 2D histograms.
Furthermore, in Rivet one can specify whether all the generated subplots (in the case of the figures above, there are 5 subplots) should be saved as one image file (as in the case above) or as separate files.
I also added tests to the Rivet-specific plotting code using the pytest package.
Remaining issues
- The main 2D histogram plotting function in Rivet,
plot_2Dhist, should be refactored, as there is some code repetition. - More tests can be added, as the code coverage is currently quite low. Testing the images using
pytest-mplwould also be beneficial. - Some formatting options do not work for 3D plots the same way as for 2D plots in matplotlib. One can for example currently not set an axis to log scale for 3D plots.
Merge status
These changes are currently in the matplotlib-GSoC branch. The Rivet-specific code will be merged into the main Rivet branch, while the general plotting API will be merged in YODA, a separate package for histograms. will be merged into the main branch once the new plotting backend can fully replace the current plotting backend.
The Rivet-specific 2D histogram plotting code is in
- rivet_plot2d.py (should be moved to the pyext/rivet/ directory)
- test_rivet_plot2d.py (should be added to the CI/CD pipeline)
The general plotting API is in
- yoda_plot2d.py (should be moved to the plotting directory).
- format_axis.py (should be moved to the plotting directory)
Other contributions
Fonts
I also identified which font is being used by the old plotting backend and identified how to configure matplotlib to use the same font. Specifically, for regular text, the URW Palladio L font is used, while for mathematical expressions, the PazoMath font is used.
These fonts are specified via an .mplstyle file, which also specifies additional matplotlib rcParams that determines how plots in Rivet should be formatted.
Currently, manual configurations of the fonts and the .mplstyle file are needed to add the Rivet style to matplotlib. This is something that needs to be improved in the future, by automating this configuration using automake, which will be executed when Rivet is installed. Some resources that are relevant to solving this issue are:
- Where to put the mplstyle file so that matplotlib can find it
- How to make matplotlib find fonts installed in a custom location
Miscellaneous
Additional issues and merge requests I have contributed to during GSoC:
- https://gitlab.com/hepcedar/rivet/-/issues/233
- https://gitlab.com/hepcedar/rivet/-/merge_requests/322
- https://gitlab.com/hepcedar/rivet/-/merge_requests/307
- https://gitlab.com/hepcedar/rivet/-/merge_requests/318
Conclusions
In conclusion, Google Summer of Code was a valuable experience for me. I learned how to use git in a collaborative environment, how to use advanced matplotlib, learning which types of software is used by particle physicists, as well as how to collaborate on an open-source project.
I would like to thank my mentors Andy Buckley and Christian Bierlich, who both have been supportive during the entirety of the program and tirelessly answered all my questions. I would also like to thank Matthew Filipovich, who I have worked with during this program and who I could discuss implementation ideas with.